Quarterly Residential Review Q3 2020

Welcome to the ERA Shields Quarterly Residential Review or Stat Pack. The intent for providing information to you is to educate you on the current local real estate market so you can better make decisions for you and your family. Real estate markets vary from city to city as well as neighborhood to neighborhood. When the national media reports how the real estate market is doing, it is reporting on national numbers and it is likely very different from how your neighborhood is performing. You will find factual data within this document from which you may draw your own conclusions. We include a brief summary on the last page.
QUICK FACTS
- The number of Active Listings were down 17% for the quarter
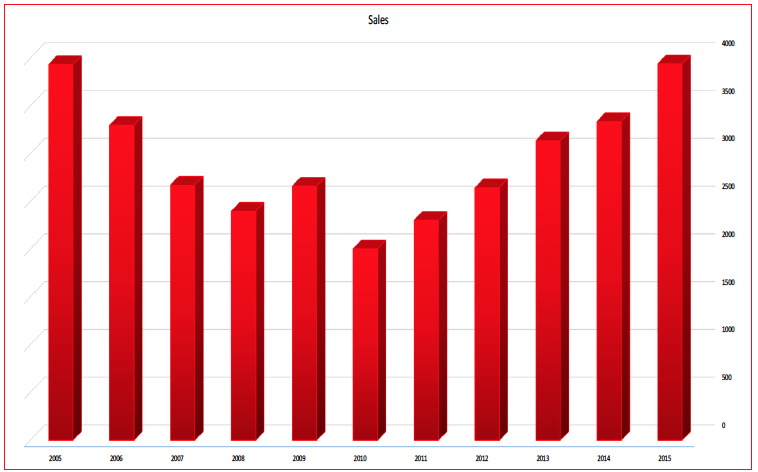
- The number of Sales for the 3rd Quarter was the most on record
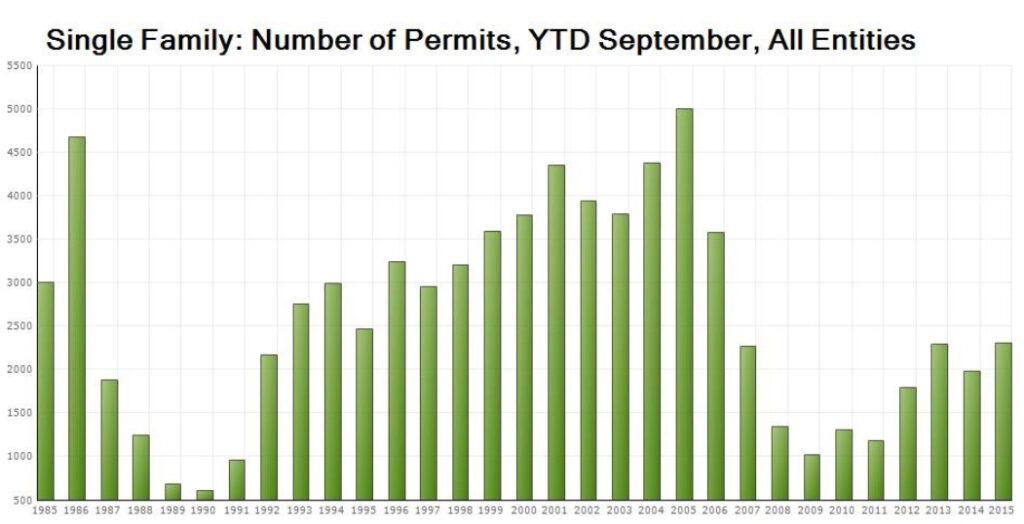
- Single Family Building Permits for the year are up slightly 16%
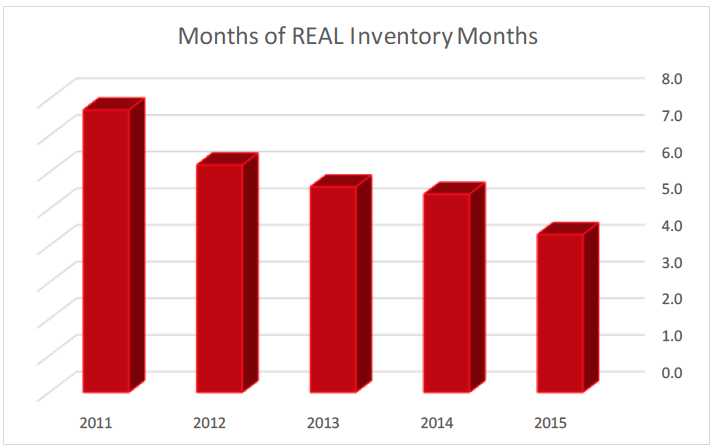
- The REAL Inventory Level has bumped up to 4.6 months
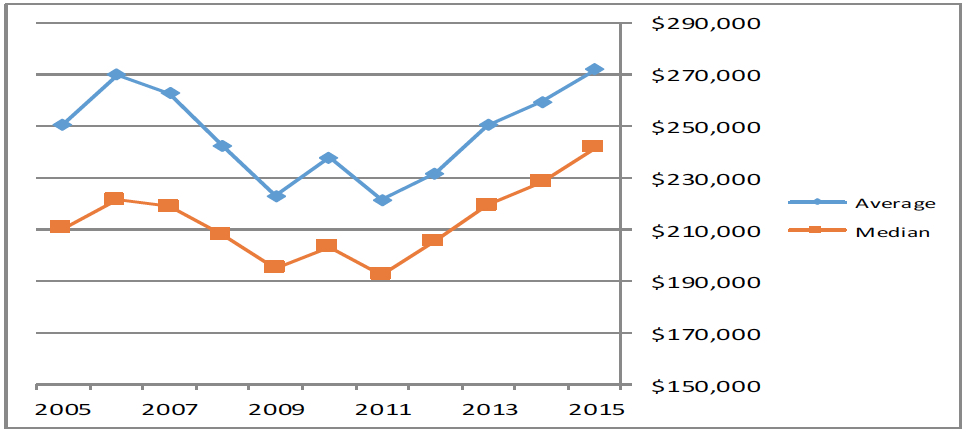
- Average Sales Price jumped 5% while the Median Price jumped 6%
- 71% of sales in the past month were under $300K
- Foreclosure starts for the year are down 30%
This graph compares the number of homes on the market (Active & Under Contract) to the number of homes Sold. It determines how many months it would take to sell through the current listing inventory. Most economists consider 6.0 months to be a balanced market.
PRICING TOOLS
Determine how your neighborhood is performing. Quarterly Area Comparisons for Single Family & Patio Homes
This chart is ideal for helping you determine how your neighborhood is doing. If you are considering selling your home, this information is just one tool you can reference to assist you with pricing your home strategically. Contact us if you need assistance utilizing this graph.
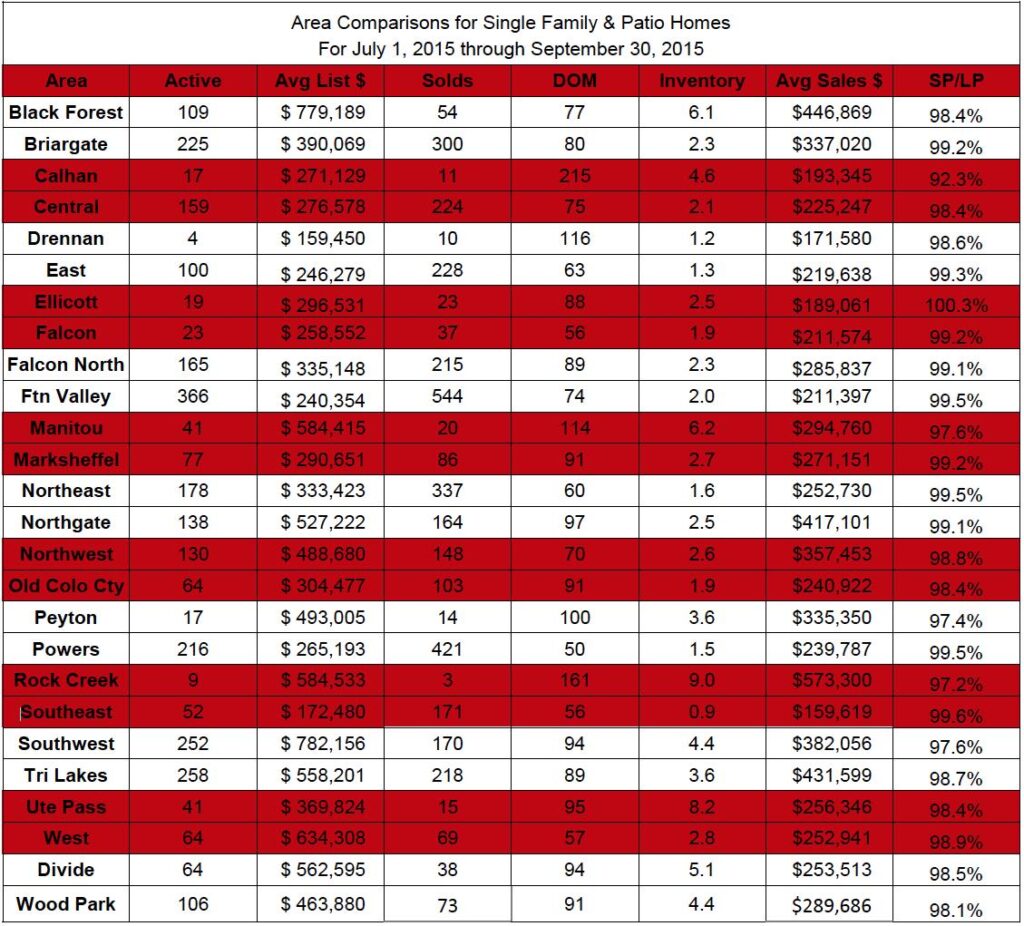
*Inventory = The number of months it would take to sell through the current active listings at the current sales rate if no other homes came on the market.
**DOM = Days on Market for the homes which actually sold.
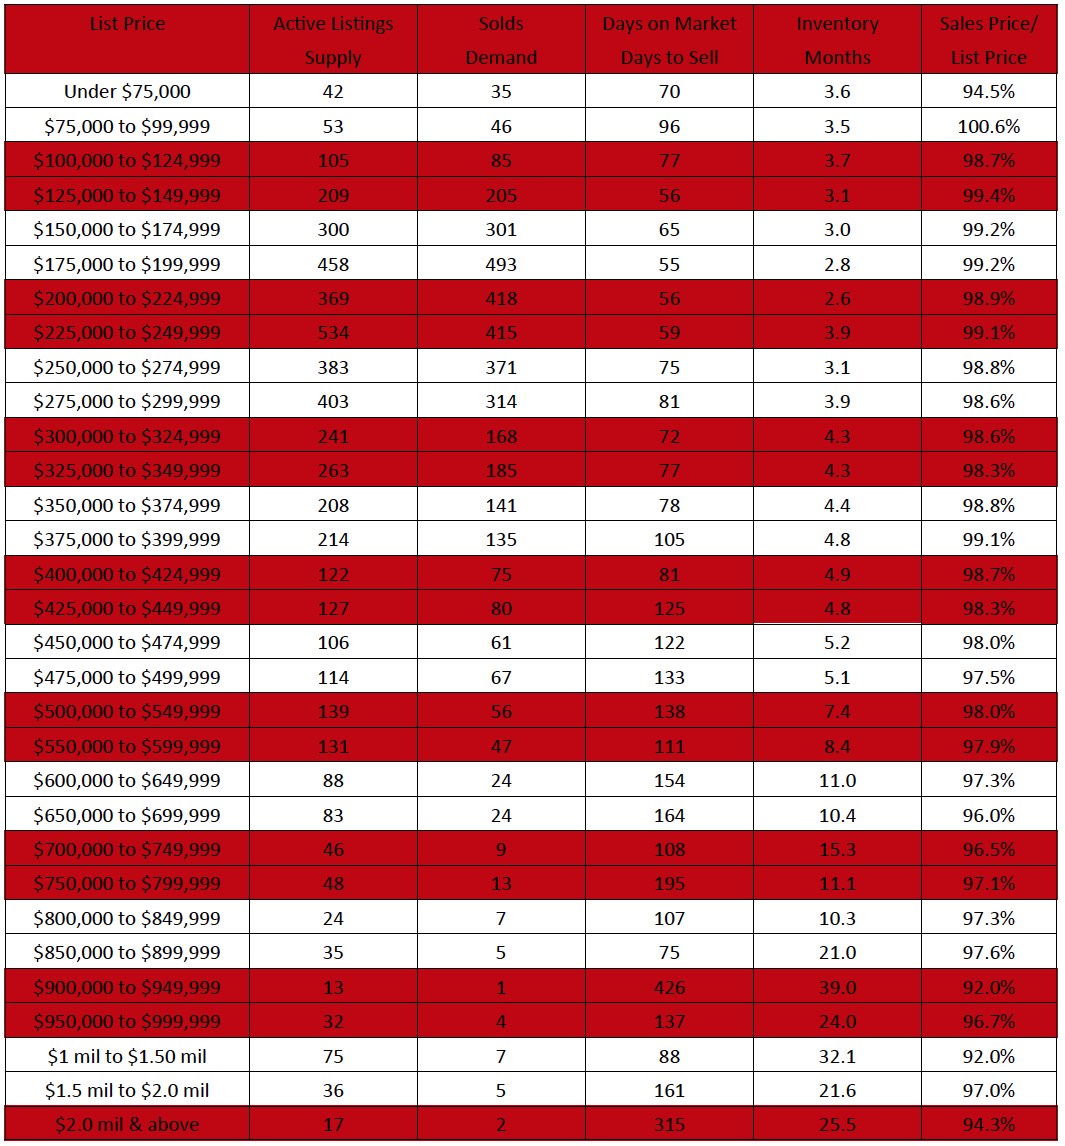
Price Range Comparisons Single Family & Patio Homes
This chart is ideal for helping you determine how your neighborhood is doing. If you are considering selling your home, this information is just one tool you can reference to assist you with pricing your home strategically. If you have questions on how
QUARTERLY DATA
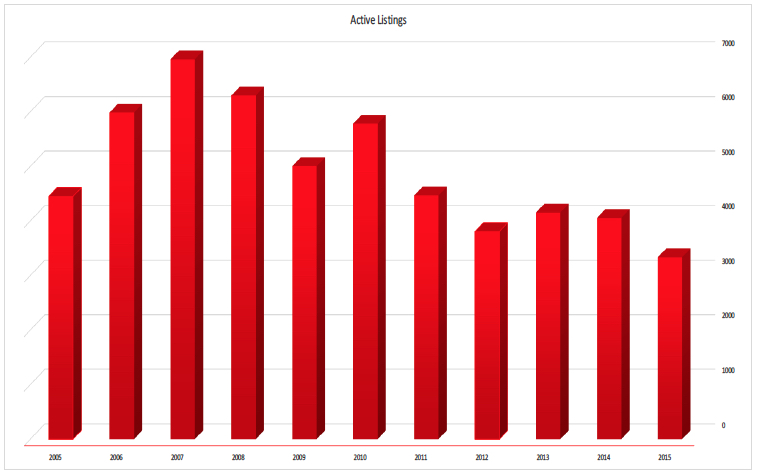
Active Listings at the end of the period when compared to the same period the previous 10 years show remarkable improvement.
This graph shows the total number of Solds for the period. Comparing this data over the past 10 years helps determine what trends are occurring.
The Average & Median Sales Prices for the same period over the past 10 years. This graph easily illustrates the current health of the local real estate market.
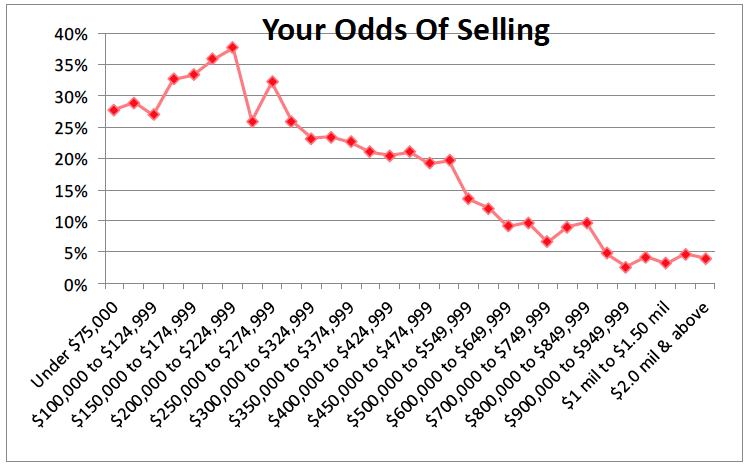
The price range of your home dictates your odds of selling. Generally, the lower your price, the more potential buyers.
Summary
The residential real estate market in the Colorado Springs metro area posted another record quarter for units sold and home prices. The real drivers of our market continue to be low mortgage rates and the low number of homes on the market. When you combine the lack of homes on the market with strong number of buyers you get the record low inventory numbers and if you recall Economics 101…fewer choices/options when there are lots of buyers = higher prices.
If you own a home within the City Limits of Colorado Springs, the market is good to excellent. The south-east area (near the airport) remains the hottest part of the market within the city with less than a month of inventory. The southwest area (near The Broadmoor) is the slowest within the city but it only has 4 months of inventory. The areas outside of town struggling some include Black Forest (6.1 months), Manitou (6.2 months) and Ute pass (8.2 months).
When you look at price ranges, the market remains very hot up to $300k. However, we did see several very expensive homes sell this quarter (14 sold for $1 million or more) which is alleviating some of the high priced inventory. Another interesting fact is sellers are getting 99.0% of their asking price.
The current market is really a great opportunity for most buyers. First time home buyers this year who bought a home for $150,000 in May already have some solid equity. The move-up buyer has really cleaned up as they sold their house at a premium (because the under $300k is sizzling) and bought a home in the sluggish price range of $450k. The only buyer who potentially may not see achieve these results are the move down buyer.
The data found within the ERA Shields Real Estate Stat Pack, Quarterly Residential Review, is based on information from the Pikes Peak REALTOR® Services Corporation (RSC) or its PPMLS. This content is deemed reliable; however RSC, PPMLS and ERA Shields Real Estate do not guarantee its accuracy. Data maintained by RSC does not reflect all real estate activity in the market. Additional sources include the Colorado Springs Business Alliance, El Paso County Assessor, El Paso County.


